


40% surge, active addresses hit 6-month high

Solana price continued its recent recovery, reaching its highest level since November last year, and the soaring network activity and ETF inflows suggest that it has room for more gains.
Summary
- Solana has moved into a technical bull market after rising by 25% from its lowest level in December.
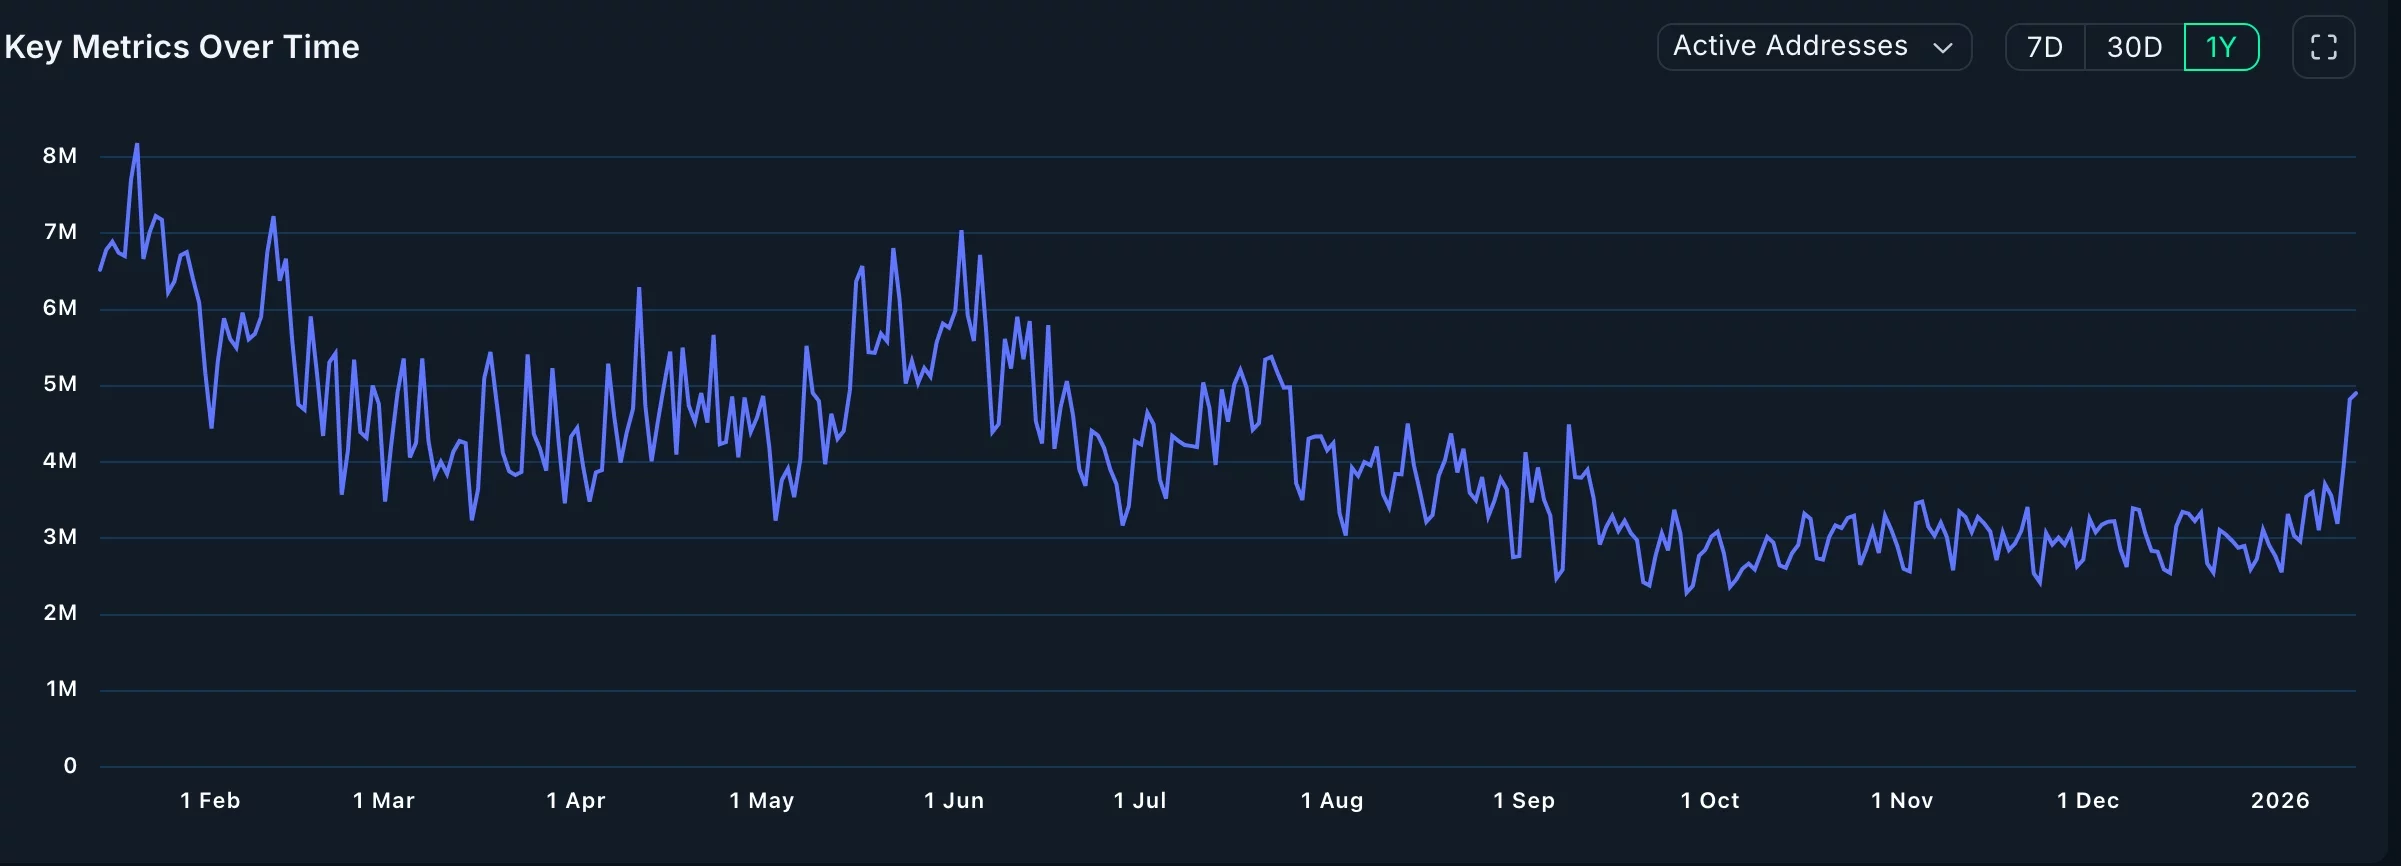
- The number of active addresses in the network has jumped to the highest level in months.
- Technical analysis suggests that the token has more upside to go in the near term.
Solana (SOL) rose to $145, up by 25% from its lowest level in December as the crypto market rally continued.
Nansen data indicate that Solana exhibits strong network metrics, which may support its recovery. The number of active addresses rose to over 4.8 million, up from the December low of 2.4 million. These numbers have jumped to their highest level in over six months.
More data shows that the number of transactions in the network has jumped to over 97.2 million, its highest level since August last year. It has handled over 1.7 billion transactions in the last 30 days, much higher than other popular chains like Ethereum and BSC.
More data shows that Solana’s ecosystem is also doing well, led by Pump. The network processed transactions worth over $121 billion in the last 30 days, higher than what Ethereum, BSC, and Base Blockchain handled combined
Solana is also seeing robust demand from American institutional and retail investors, with the cumulative inflows to its exchange-traded funds rising to over $833 million and the net assets hitting $1.18 billion.
This growth is likely attributable to its strong metrics in key areas such as decentralized finance and real-world asset tokenization, where it is the second-largest chain after Ethereum.
Solana’s next major catalyst will happen this quarter when the developers will launch the Alpenglow upgrade, which will introduce more features. For example, Alpenglow will introduce faster speeds and major changes to its architecture.
Solana price technical analysis
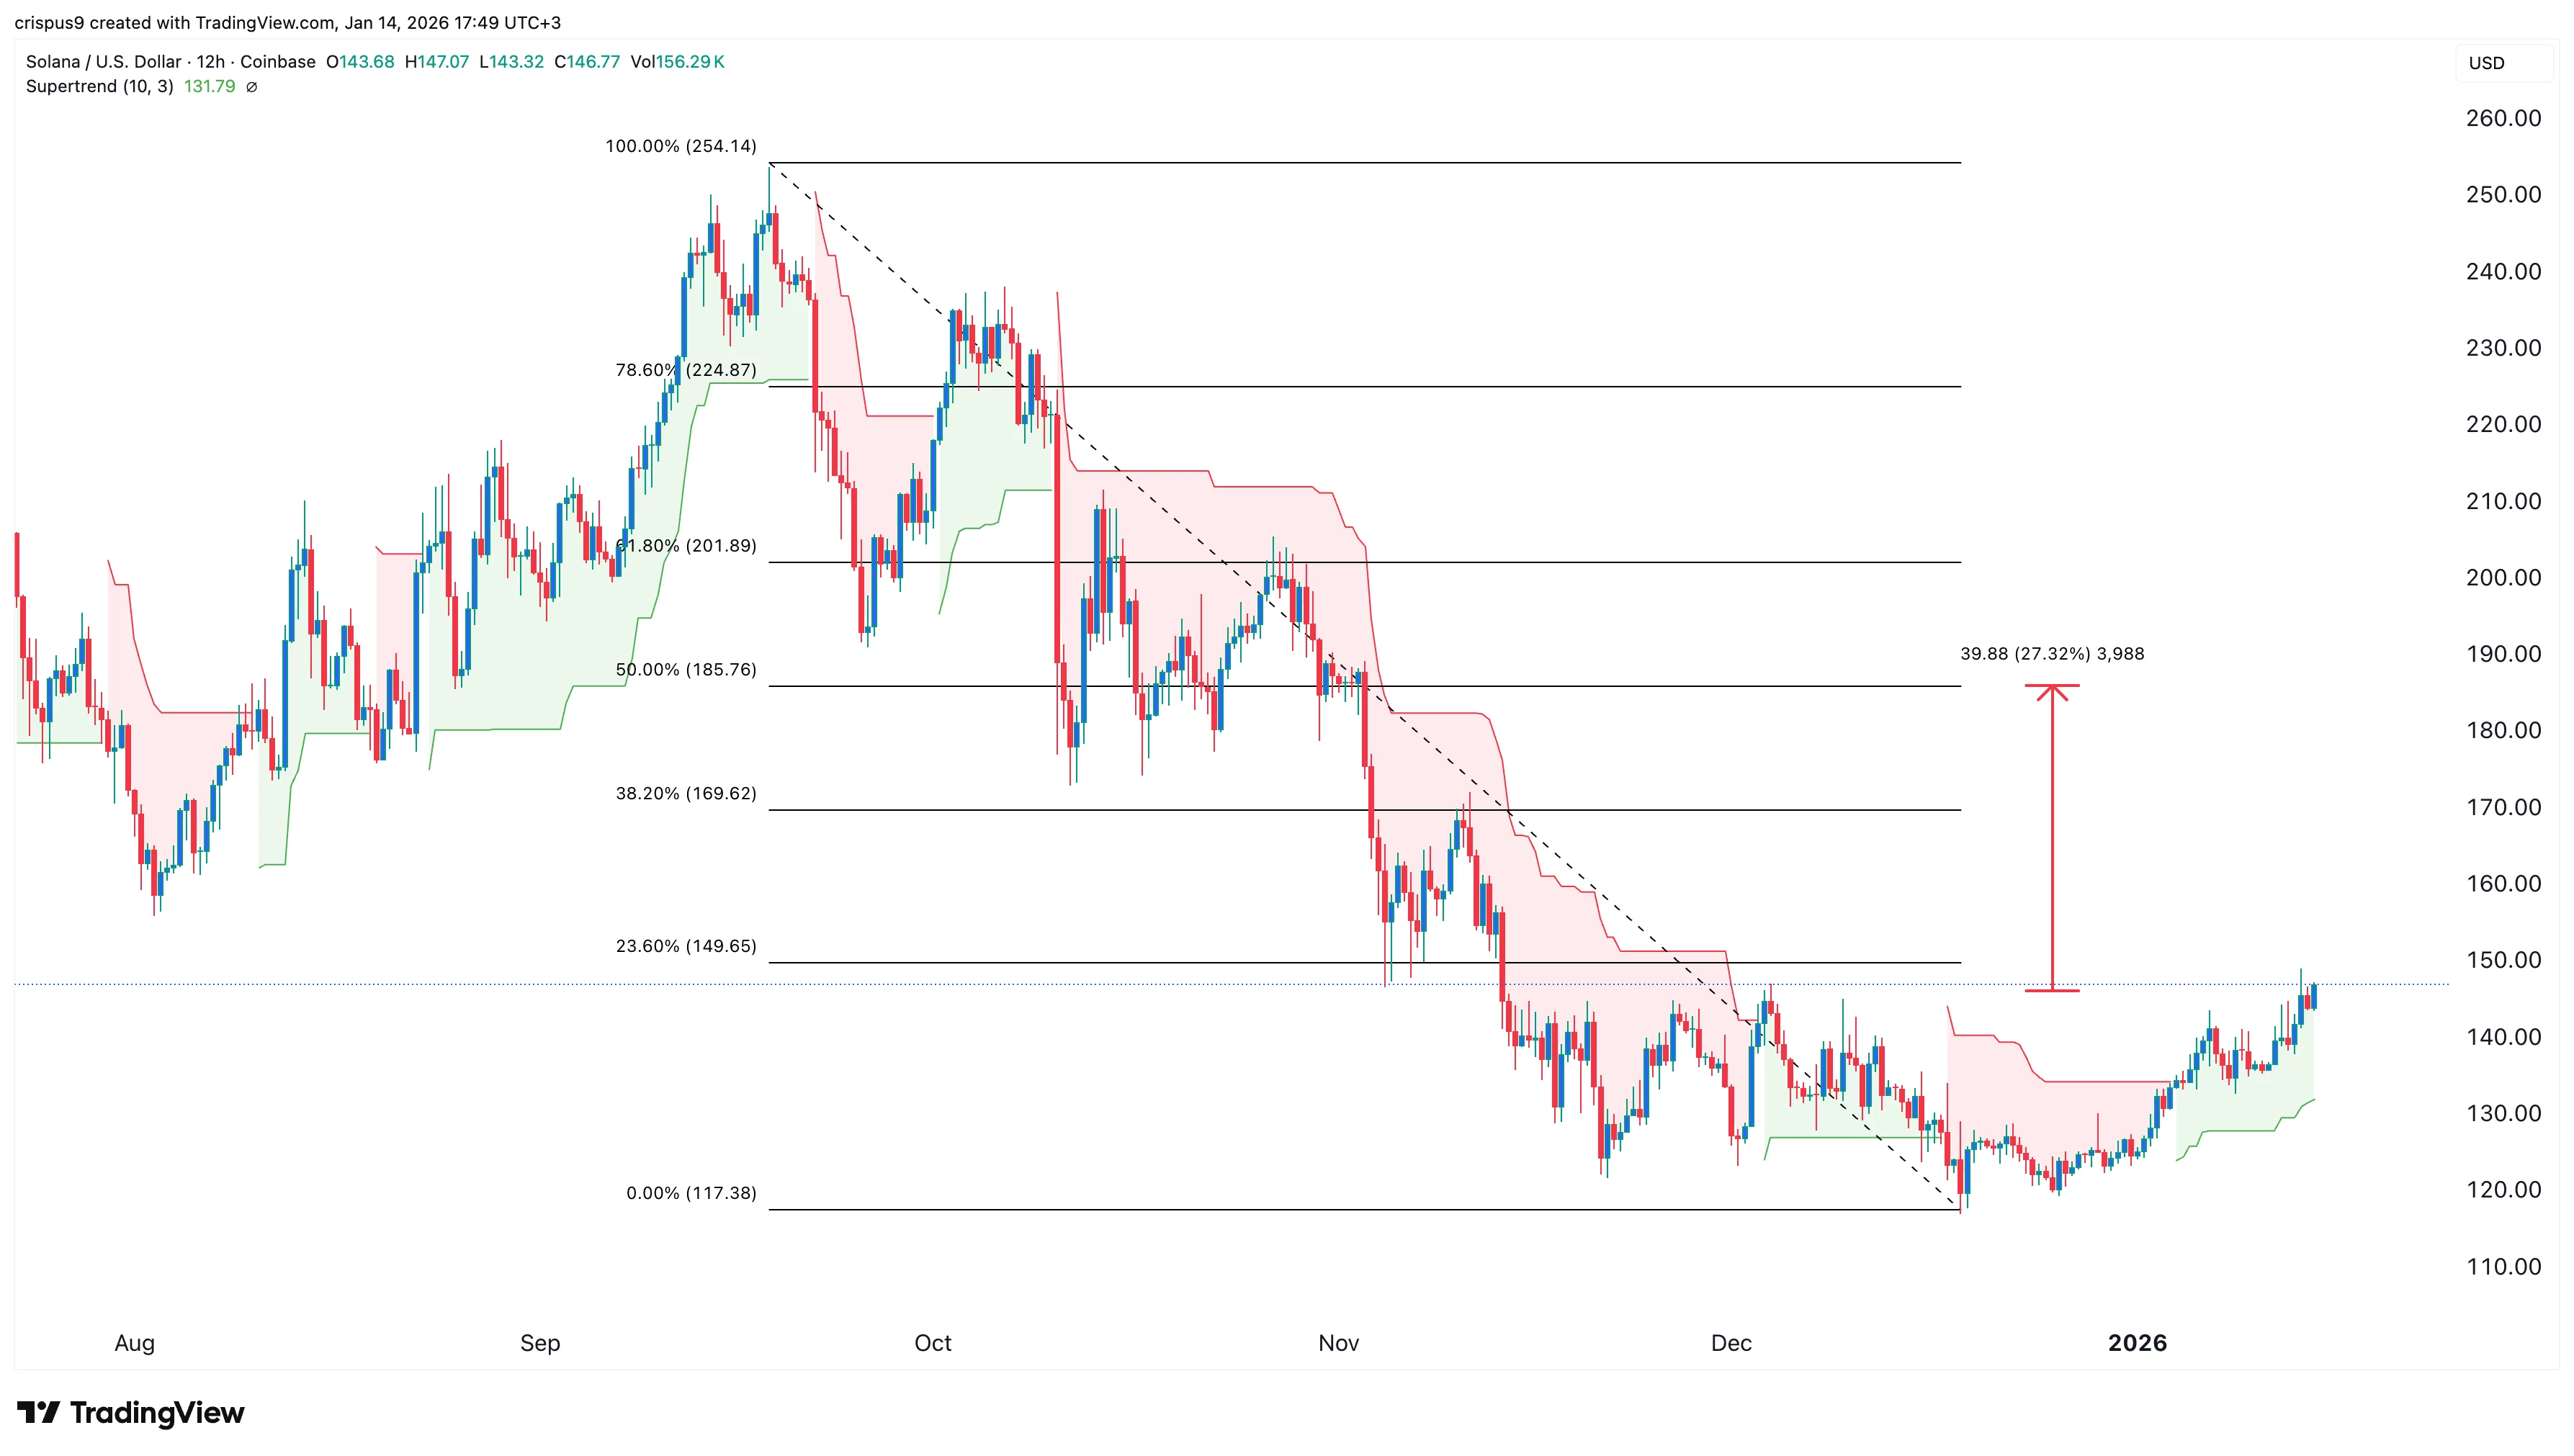
The 12-hour timeframe chart shows that the SOL token has jumped from the December low of $117 to the current $145. It has formed a rounded bottom pattern and is nearing the 23.6% Fibonacci Retracement level.
Solana token has moved above the 50-period Exponential Moving Average (EMA) and flipped the Supertrend indicator from red to green. In most cases, cryptocurrencies and other assets often rally whenever the Supertrend turns green.
Therefore, the next key target for Solana’s price is the 50% retracement level at $185, approximately 40% above the current level.