


Bitcoin price targets $65,000: Bear market bottom?

This moment is quite precarious for Bitcoin. After rejecting the upper boundary of its long-standing ascending channel, Bitcoin has transitioned into a corrective phase, pulling back toward a critical support zone around $65,000.
Summary
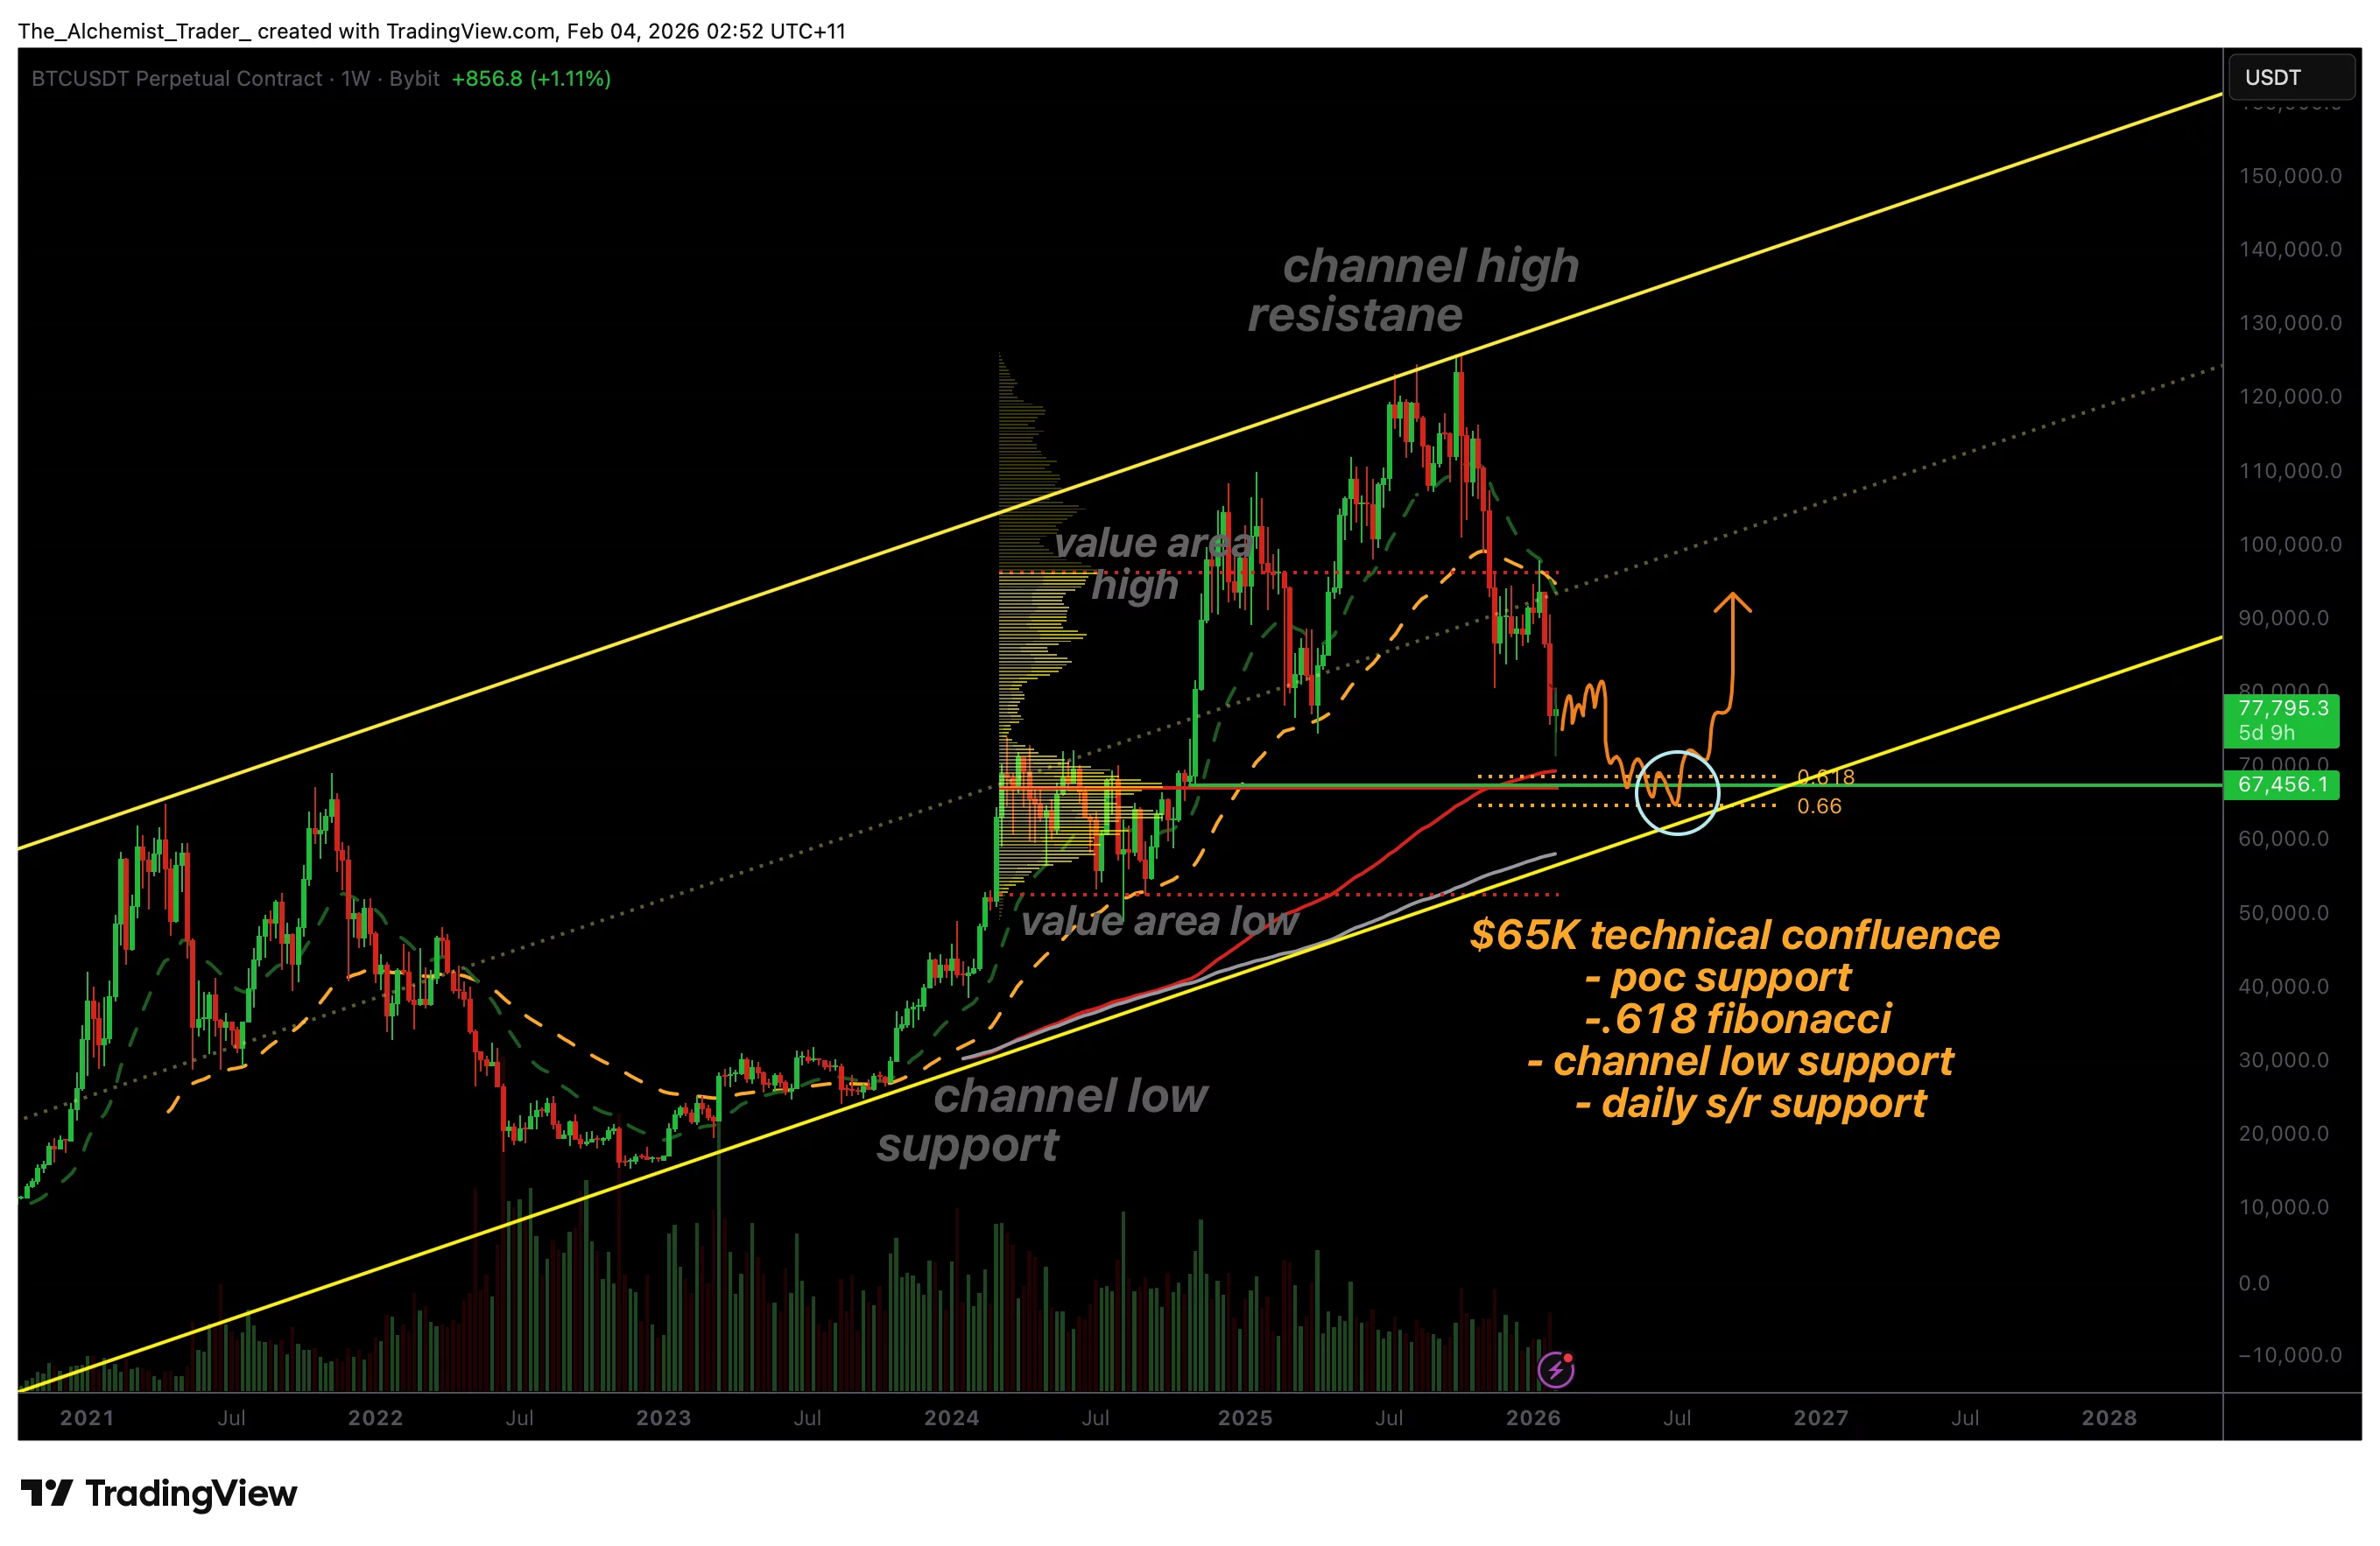
- Bitcoin corrected lower after rejecting the channel high resistance
- $65,000 aligns with POC, Fibonacci, channel low, and daily support
- Bullish volume is required to confirm a macro bottom and rotation higher
The current Bitcoin (BTC) price is just above $73,000. Following a rejection at the upper boundary of a long-standing ascending channel, the largest digital asset by market cap has transitioned into a controlled pullback rather than a disorderly sell-off.
This corrective move has gradually guided the price lower toward a region that carries significant technical weight across multiple analytical frameworks.
The $65,000 level is now emerging as a focal point for market participants. This area represents not just a psychological round number, but a dense cluster of technical confluences that historically attract demand.
As Bitcoin approaches this zone, the market is testing whether buyers are willing to defend the value and establish a potential bear-market bottom within the broader macro uptrend.
Bitcoin price key technical points
- Corrective rotation from channel high: Bitcoin respected upper channel resistance before rotating lower.
- $65,000 aligns with multiple confluences: Daily support, Fibonacci retracement, channel low, and POC converge.
- Bullish volume required for confirmation: Accumulation must be backed by strong demand to validate a bottom.
From a structural perspective, Bitcoin remains within a clearly defined higher-timeframe trading channel. The recent move lower followed a clean rejection at channel high resistance, reinforcing the integrity of this structure. Rather than breaking down impulsively, price has respected the channel dynamics, suggesting that the move lower is corrective rather than trend-ending.
After the rejection, Bitcoin initially rotated toward the value area low, a zone often associated with downside exploration following failed attempts at higher value. This rotation also coincided with the channel midpoint, a level that frequently acts as a pivot between bullish continuation and deeper corrective phases. Once price lost acceptance above both the channel midpoint and the value area high, downside pressure accelerated.
This loss of key mid-range levels triggered a cascading move lower toward the point of control (POC), where the highest historical trading volume has occurred. Importantly, this POC region is near $65,000, reinforcing its potential as a stabilization zone.
Why $65,000 is a high-probability support zone
The $65,000 level stands out due to the sheer number of technical factors converging at this price. First, it represents a daily support level that has previously acted as both resistance and support, making it a well-recognized reference point for market participants.
Second, the 0.618 Fibonacci retracement of the prior impulsive move aligns closely with this region. The 0.618 level is widely monitored as a corrective support zone within trending markets and often serves as a location where larger players re-enter positions.
Third, $65,000 sits near the lower boundary of the higher-timeframe channel, completing a textbook channel rotation from high to low. When price respects both channel extremes, it strengthens the validity of the structure and increases the probability of mean reversion back toward the midpoint.
Finally, the presence of the point of control in this area suggests that the market views this zone as fair value. When price returns to the POC after a directional move, it often pauses or reverses as buyers and sellers reassess positioning.
Volume, accumulation, and market psychology
While technical confluence increases the probability of a reaction, confirmation depends heavily on volume behavior. For $65,000 to act as a meaningful bear market bottom, Bitcoin must show signs of accumulation, characterized by strong bullish volume influxes and slowing downside momentum.
Without volume confirmation, any bounce risks being short-lived. However, if buyers step in aggressively and defend this level, it would signal that demand is present at discount prices. This type of behavior is often observed near macro bottoms, where long-term participants accumulate while short-term sentiment remains cautious.
From a psychological standpoint, a successful defense of $65,000 would also reinforce confidence in the broader market structure. It would demonstrate that Bitcoin continues to respect its channel framework, even during periods of corrective pressure.
What to expect in the coming price action
From a technical, price-action, and market-structure perspective, Bitcoin is approaching one of the most important support regions in the current cycle. The $65,000 level has multiple strong confluences that increase the likelihood of a bear-market bottom forming.
If bullish volume emerges and price stabilizes within this zone, a rotational move back toward the channel midpoint becomes increasingly probable, keeping the broader uptrend intact. Failure to attract demand, however, would weaken the channel structure and increase downside risk.
As Bitcoin tests this region, the market’s response will provide critical insight into whether $65,000 becomes a defining macro bottom or merely a temporary pause within a deeper corrective phase.