


Hyperliquid price charts bullish reversal pattern as network earnings spike, rebound coming?
Hyperliquid price action recently confirmed a breakout from a bullish reversal pattern, supported by a notable uptick in network revenue.
Summary
- Hyperliquid price has been in a downtrend for over a week.
- Weekly revenue generated on Hyperliquid has increased nearly 200% since late December.
- A falling wedge pattern confirmed on the 4-hour chart could position the token for further gains.
After rallying to a yearly high of $37.84 on Feb. 3, the Hyperliquid (HYPE) price retraced nearly 18% to $31.06 at the time of writing.
This downtrend coincided with wider weakness across altcoins and majors like Bitcoin (BTC) and Ethereum (ETH), partly driven by a stronger-than-expected U.S. labor market report, which reduced the likelihood of imminent Fed rate cuts. Meanwhile, significant whale selloffs have also hurt its price performance.
Despite the recent price dip, a key network metric suggests that the token could be up for a recovery soon.
Data from DeFiLlama show that the revenue generated by the network over the past week has surged nearly 200% over levels recorded around the end of December. This uptick in revenue follows a spike in commodities futures trading on the platform, especially silver and gold markets.
Increased trading activity directly benefits HYPE holders through its unique buyback and burn mechanism. Notably, the protocol uses 97% of the fees generated by the derivatives trading platform to buy back HYPE from the open market, thereby reducing the available supply, which ultimately helps in supporting the price against volatility. Additionally, if Hyperliquid pairs are used for these trades, the protocol can burn them permanently to further increase scarcity.
There’s also considerable hype around upcoming updates. The Hyperliquid team has teased plans to support outcome trading via the HIP 4 upgrade, a feature that would be useful for the burgeoning prediction markets. A testnet version of HIP 4 is currently live.
On the 4-hour chart, Hyperliquid price has broken out of a falling wedge pattern formed of two descending and converging trendlines. Once confirmed, this pattern has historically been a precursor to staunch rallies.
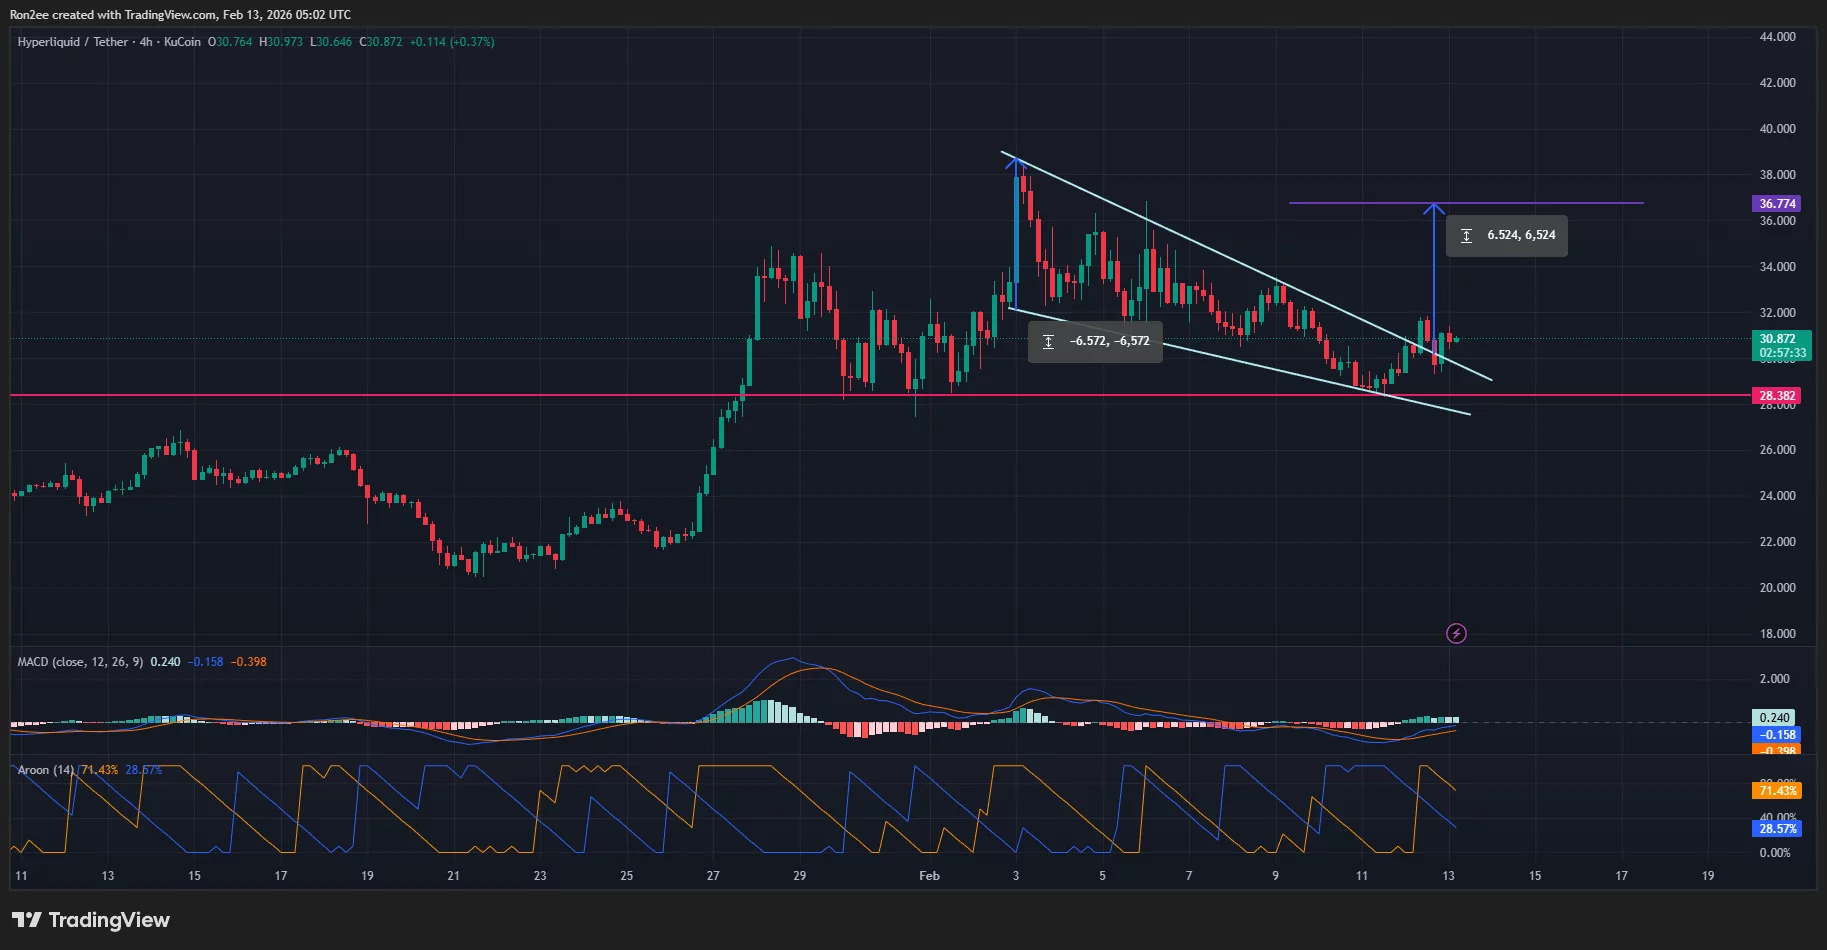
Calculating a target based on this breakout would put HYPE on a path towards $36.70. This is calculated by adding the height of the pattern to the price at which it broke out of the upper trendline. At press time, this level lies roughly 18% above the current market price.
The MACD indicator appeared to favor the bullish prediction, with the MACD lines pointing steadily upward. At the same time, the Aroon Up was at 71.4% while the Aroon Down sat much lower at 28.57%, suggesting that bulls are still dominating the market direction.
However, it should be noted that broader market sentiment is playing a very important role in gauging market direction at the time, especially as BTC and ETH have been trading sideways this week.
A sudden spike in volatility or a sharp correction in the majors, as seen earlier multiple times this year, could easily invalidate the bullish narrative and likely force the token back into a consolidation phase.
Disclosure: This article does not represent investment advice. The content and materials featured on this page are for educational purposes only.

