


Bitcoin price hits six-week high driven by short liquidations and ETF inflows

Bitcoin price briefly surged to a six-week high of $75,937 on Tuesday, as over $330 million in short positions were liquidated in the past 24 hours.
Summary
- Bitcoin price briefly surged to a six-week high as over $330 million in short positions were liquidated across the crypto derivatives market.
- Technical indicators point to strengthening momentum, with a potential rounded bottom forming while traders watch resistance near the February highs.
According to data from crypto.news, Bitcoin (BTC) price touched an intraday high of $75,937 on March 17, morning Asian time, as it broke past the $75,000 resistance for the first time since early February. The bounce past the key psychological level triggered a market-wide rally with altcoins such as MemeCore (M), FET, and Zcash (ZEC) leading gains with double-digit rallies on the day.
Bitcoin’s surge led to large-scale liquidations across leveraged crypto markets. According to data from CoinGlass, nearly $498 million was liquidated, with over $330 million coming from short positions as traders closed bearish positions opened during the early February market sell-off. Bitcoin alone specifically accounted for $118 million of those short liquidations.
Another major tailwind that supported today’s rebound is the return of consistent inflows into spot Bitcoin ETFs, signaling strong institutional demand. Data compiled by SoSoValue shows that the 12 U.S. spot Bitcoin ETFs drew in over $200 million over the past day, extending their inflow streak to 6 straight days that drew in nearly $1 billion in total.
Investors are also viewing Bitcoin as a safe-haven asset amid geopolitical tension in the Middle East, especially since traditional safe-haven assets such as gold and silver have shown relative weakness in recent days.
On the daily chart, Bitcoin price seems to be forming a rounded bottom pattern, a typical reversal pattern in technical analysis. The 20-day SMA is closing in on a bullish crossover with the 50-day SMA, a sign that short-term momentum is turning positive.
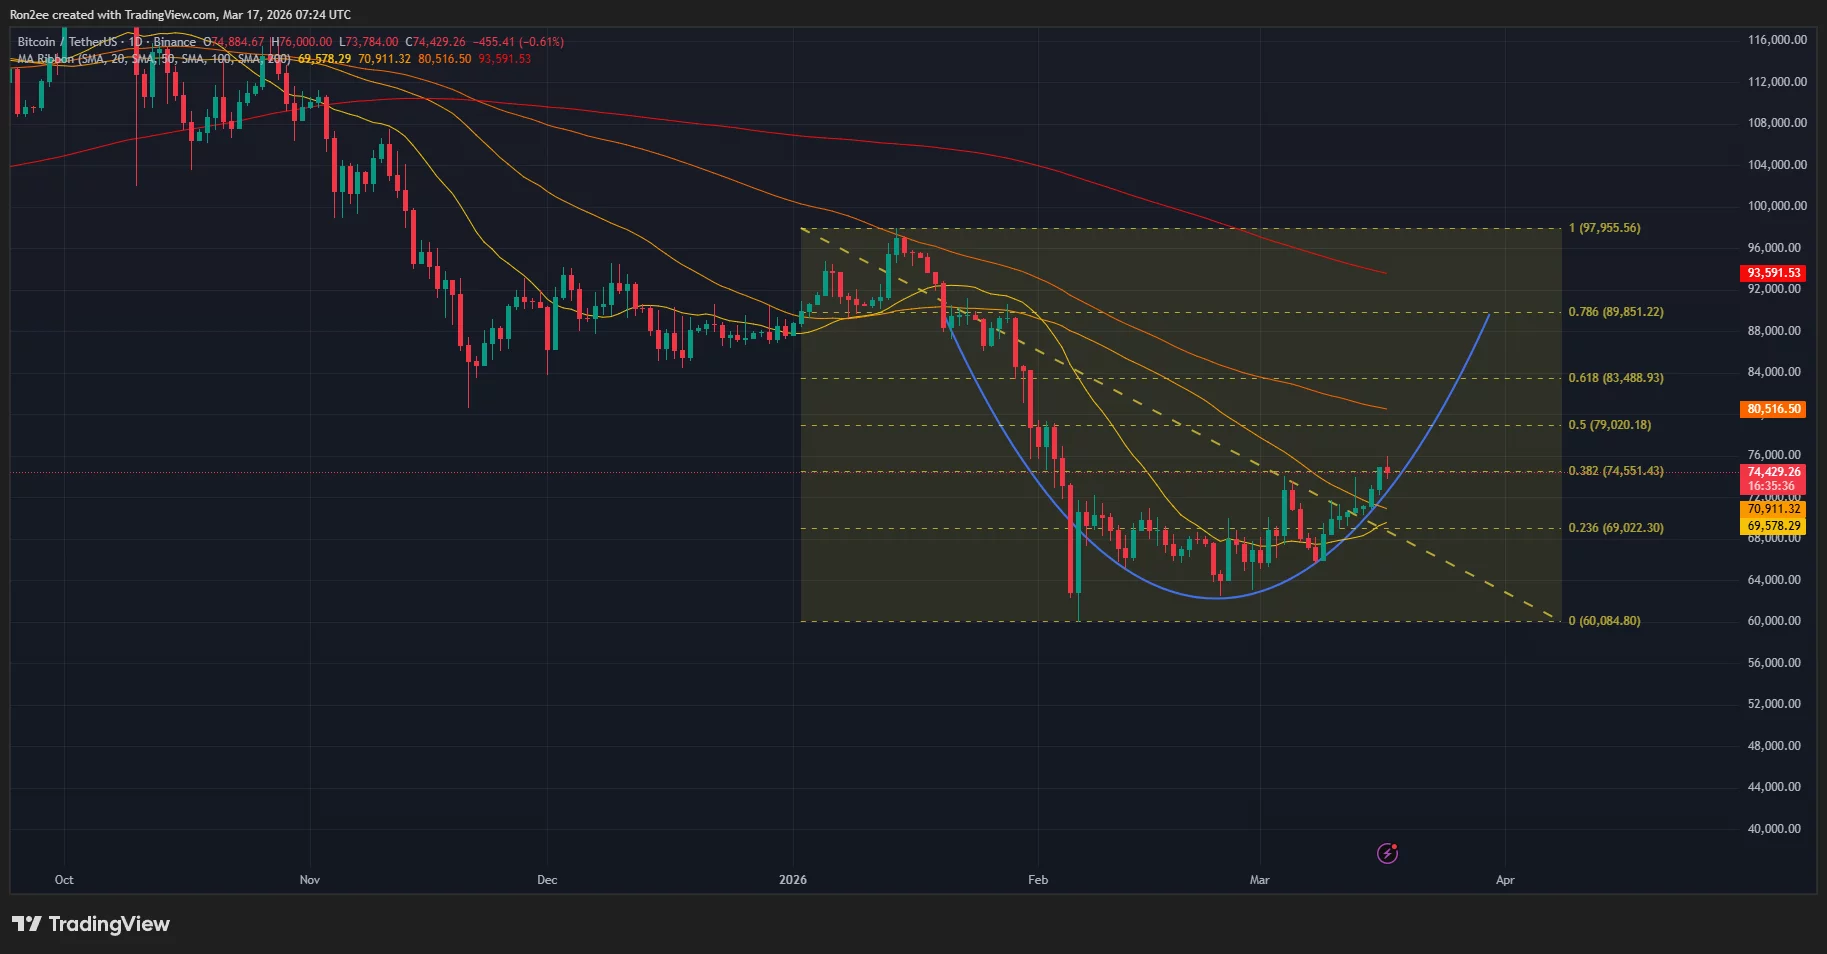
For now, the next key resistance level that traders are watching currently lies at $79,000 highs seen during February, and aligns with the 50% Fibonacci retracement level.
A sharp breakout from this level could push prices to as high as $89,850, which would be the neckline of the double bottom formed. On the contrary, failure to hold $72,000 support could lead to a retest of lower levels.
At press time, Bitcoin price was hovering around $74,000, still holding onto 6% gains over the weekly period.
Disclosure: This article does not represent investment advice. The content and materials featured on this page are for educational purposes only.