


Hyperliquid price nears $35 breakout as oil perps surge

Hyperliquid price is testing $35 as oil-linked perpetual contracts surge, driving record trading volume and attracting institutional attention.
Summary
- Hyperliquid is trading near the top of its weekly range of $35.20.
- A spike in oil perpetual contracts, driven by geopolitical tensions, has led to a surge in trading volumes
- HYPE is holding above the mid-Bollinger Band, with $35 acting as key resistance that could trigger a move toward $38–$40.
As buyers pushed the price toward the top of its weekly range, the token was trading at $34.69 at the time of writing, up 6.6% over the previous day. Hyperliquid (HYPE) has moved between $29.61 and $35.20 over the last seven days, and the most recent surge has brought the token near a possible breakout zone.
The asset is currently up on all major timeframes, with gains of 9% over the last week, 11% over the last 30 days, and 141% over the previous year. Despite the strong long-term growth, the token still sits about 41% below its September 2025 all-time high of $59.30.
Market activity has increased during the latest move higher. 24-hour trading volume reached $2.39 billion, a 21% increase from the previous day. CoinGlass data shows open interest at $1.40 billion, down slightly by 0.22%, suggesting some traders have taken profits while the price continues to climb.
Oil-linked perps drive major activity on the platform
A large share of the recent trading surge on Hyperliquid has been driven by activity in energy markets, especially the CL-USDC perpetual contract, which tracks West Texas Intermediate (WTI) crude oil.
In recent days, oil trading volume on the platform has climbed significantly as crude prices reacted to rising geopolitical tensions in the Middle East. Reports of military escalation between the US, Israel, and Iran, as well as possible threats to supply routes via the Strait of Hormuz, have raised concerns.
The oil market has moved sharply as a result of these developments, and WTI crude briefly traded between $110 and $120 per barrel.
As a result, trading activity on the CL-USDC market surged. Daily volume climbed above $1.2 billion, with some sessions ranging between $1.15 billion and nearly $2 billion. Before the latest geopolitical developments, daily trading in the contract was roughly $21 million.
Open interest in the oil-linked contract has also grown, reaching roughly $170-$195 million. At the same time, the HIP-3 permissionless perpetuals market on Hyperliquid has recorded more than $1.2 billion in total open interest.
The rapid price swings in crude markets have also triggered liquidations. Around $40 million in positions were wiped out within 24 hours, with short sellers accounting for most of the losses during the rally.
Overall platform activity has surged alongside the oil trade. Hyperliquid’s total daily perpetual volume recently climbed above $10 billion, with non-crypto markets such as commodities, equities, and metals becoming a larger share of trading.
In some trading sessions, these markets made up over 30% of the platform’s total volume.
The rise also shows that traders are turning to the platform as a round-the-clock venue to respond to geopolitical developments, particularly during hours when traditional exchanges such as the Chicago Mercantile Exchange are not open.
Hyperliquid price technical analysis
From a chart perspective, Hyperliquid is testing an important resistance area near $35. Because it rejected the price earlier in February, this level is important for traders.
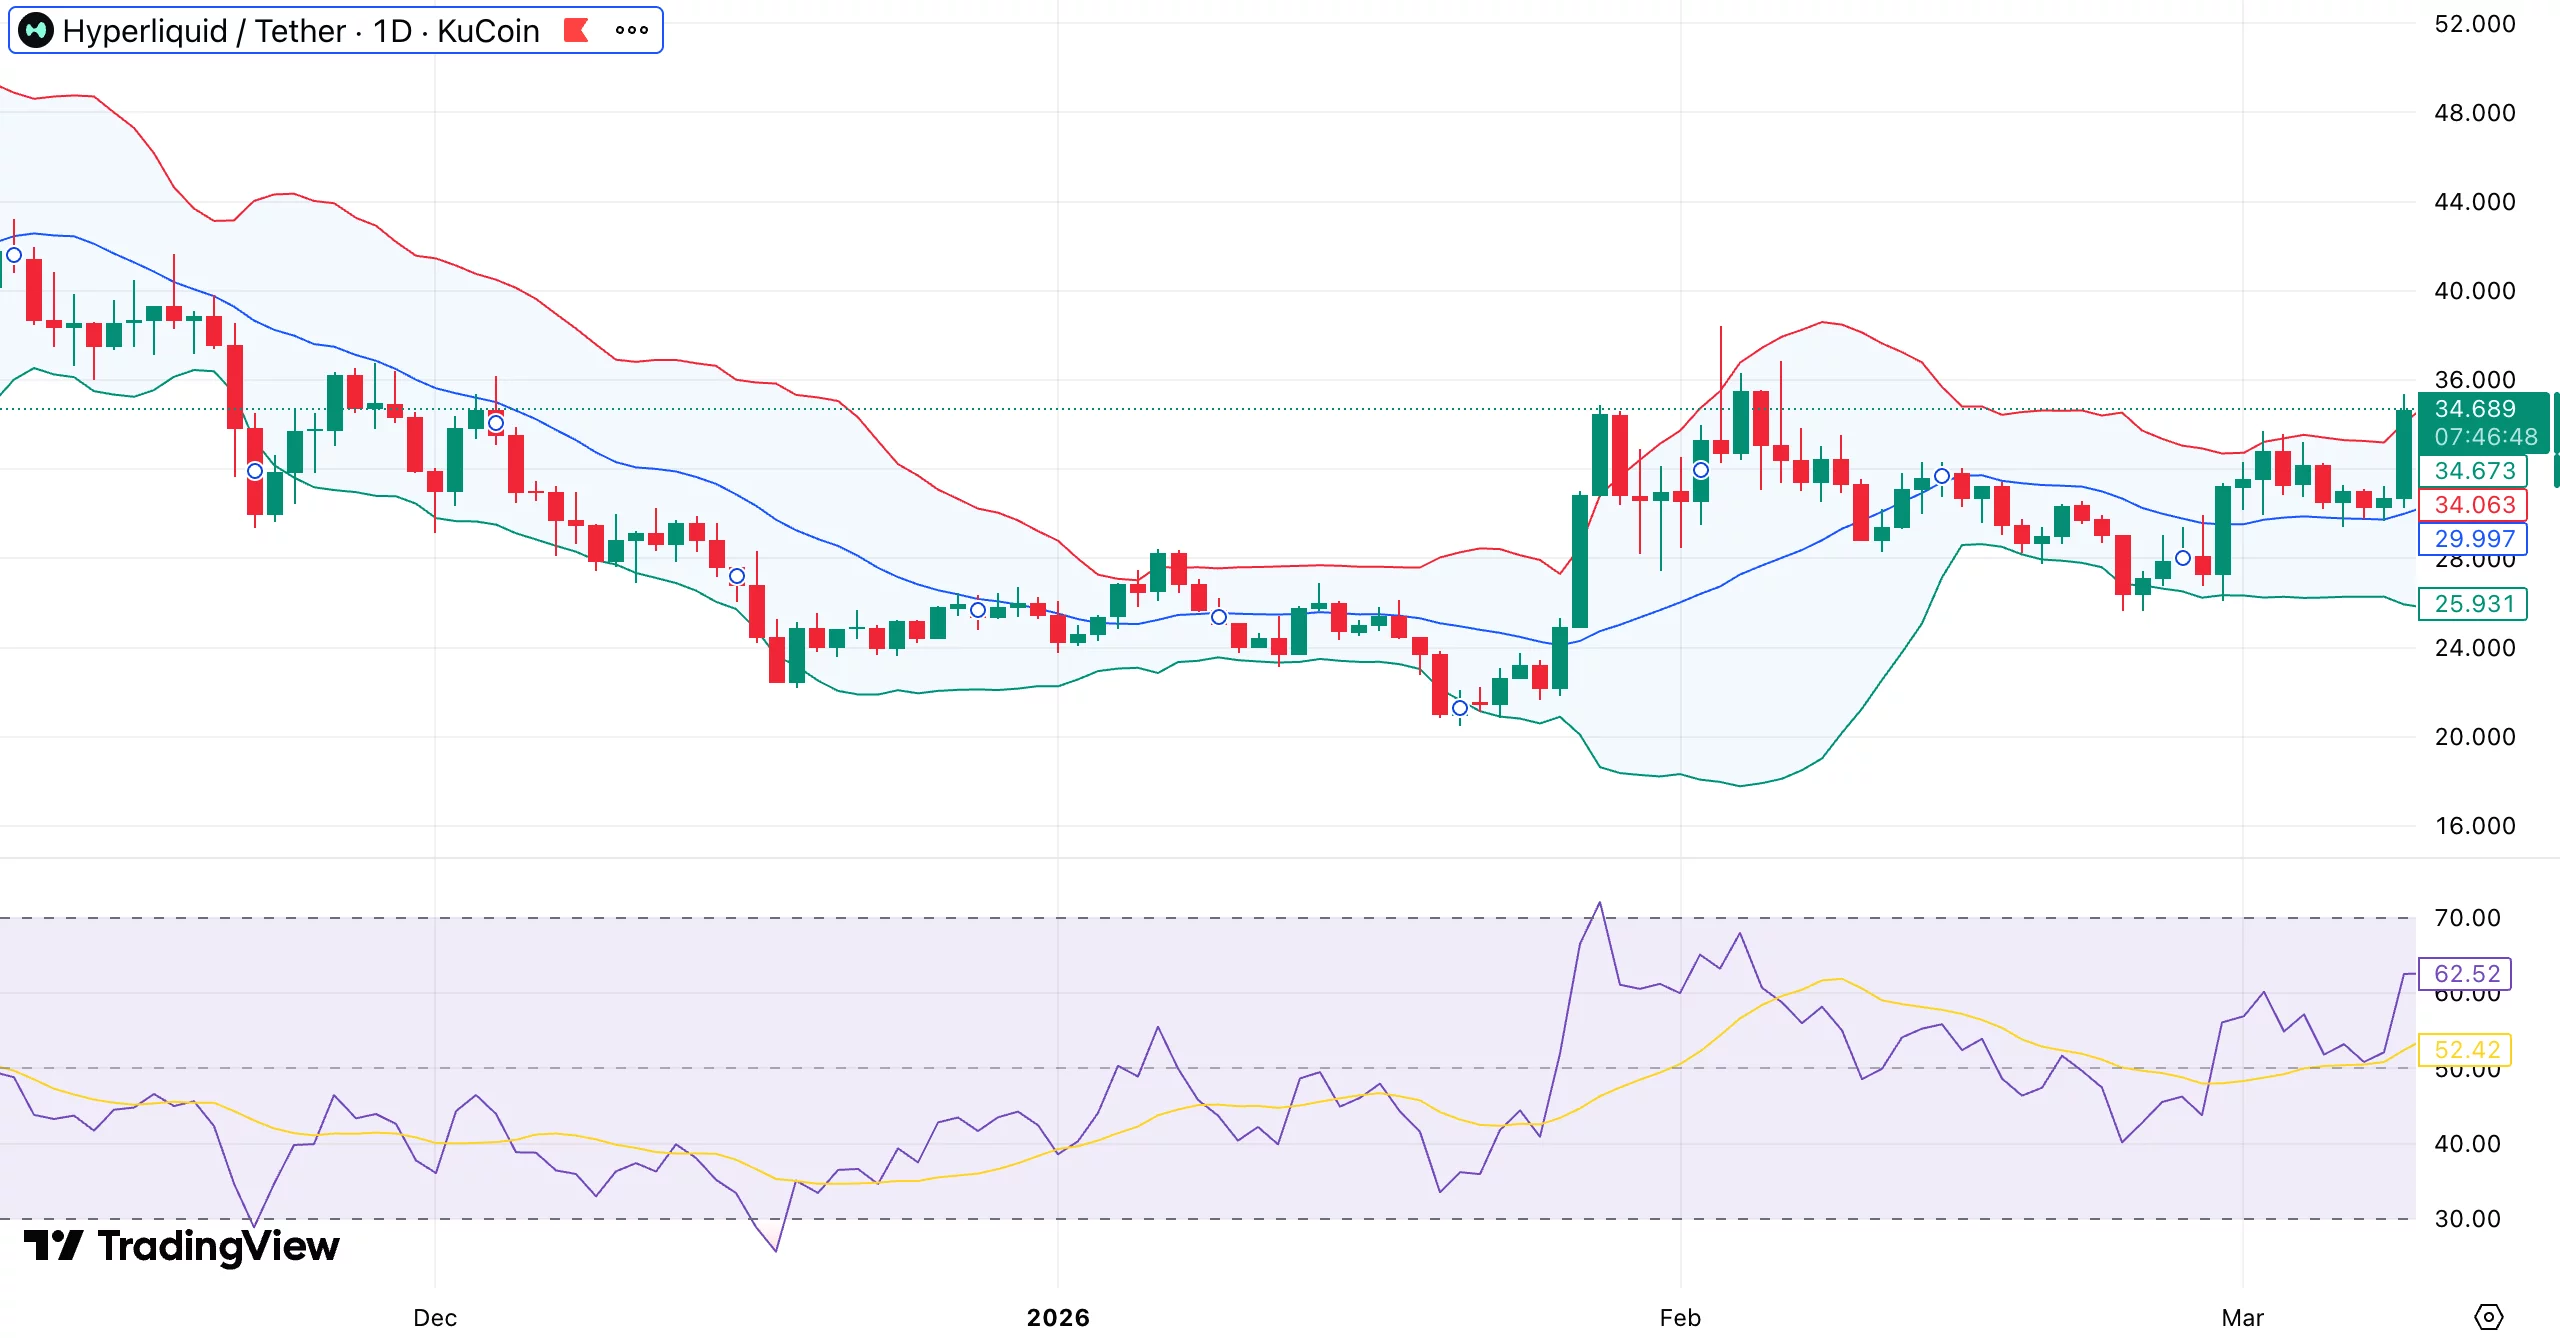
A breakout could be indicated by a daily close above $35, opening the door for the $38–$40 range. Momentum indicators are currently showing a bullish bias. The token is trading above the Bollinger Band midline at around $30, which has acted as short-term support during upward trends.
Since late February, the price has formed a series of higher lows, suggesting that buyers have been stepping in whenever there are dips. The relative strength index, which is currently at roughly 62, indicates that while the market is still below overbought territory.
Additionally, volatility is starting to rise. The Bollinger Bands are widening, a pattern that is commonly observed when markets start preparing for a stronger directional move.
If the price breaks above $35, the move could open the way toward $38 and possibly $40 as the next upside levels. However, if the level holds as resistance and the price is rejected, the token could be pushed back toward the $30 support zone, where demand previously returned.