


Why Bitcoin price gartley pattern signals potential move toward $80,000

Bitcoin price action is beginning to resemble a developing Gartley harmonic pattern, raising the probability of a technical reversal toward the $80,000–$82,000 region if key Fibonacci support holds.
Summary
- Gartley harmonic structure is developing, targeting the $80,000–$82,000 zone
- 0.618 Fibonacci support remains intact, defining a potential higher low
- Bullish volume confirmation is required, for the reversal thesis to play out
Bitcoin (BTC) has spent recent sessions consolidating after a sharp corrective move, with price behavior on the intraday timeframe beginning to form a recognizable harmonic structure. While broader market sentiment remains cautious, technical conditions suggest that Bitcoin may be entering a potential reversal zone.
The developing setup closely resembles a Gartley harmonic pattern, a formation that often precedes counter-trend rallies when supported by proper Fibonacci alignment.
Although the pattern is not yet fully confirmed, the current structure suggests that downside momentum may be weakening, opening the door for a relief rally if buyers continue to defend key support.
Bitcoin price key technical points
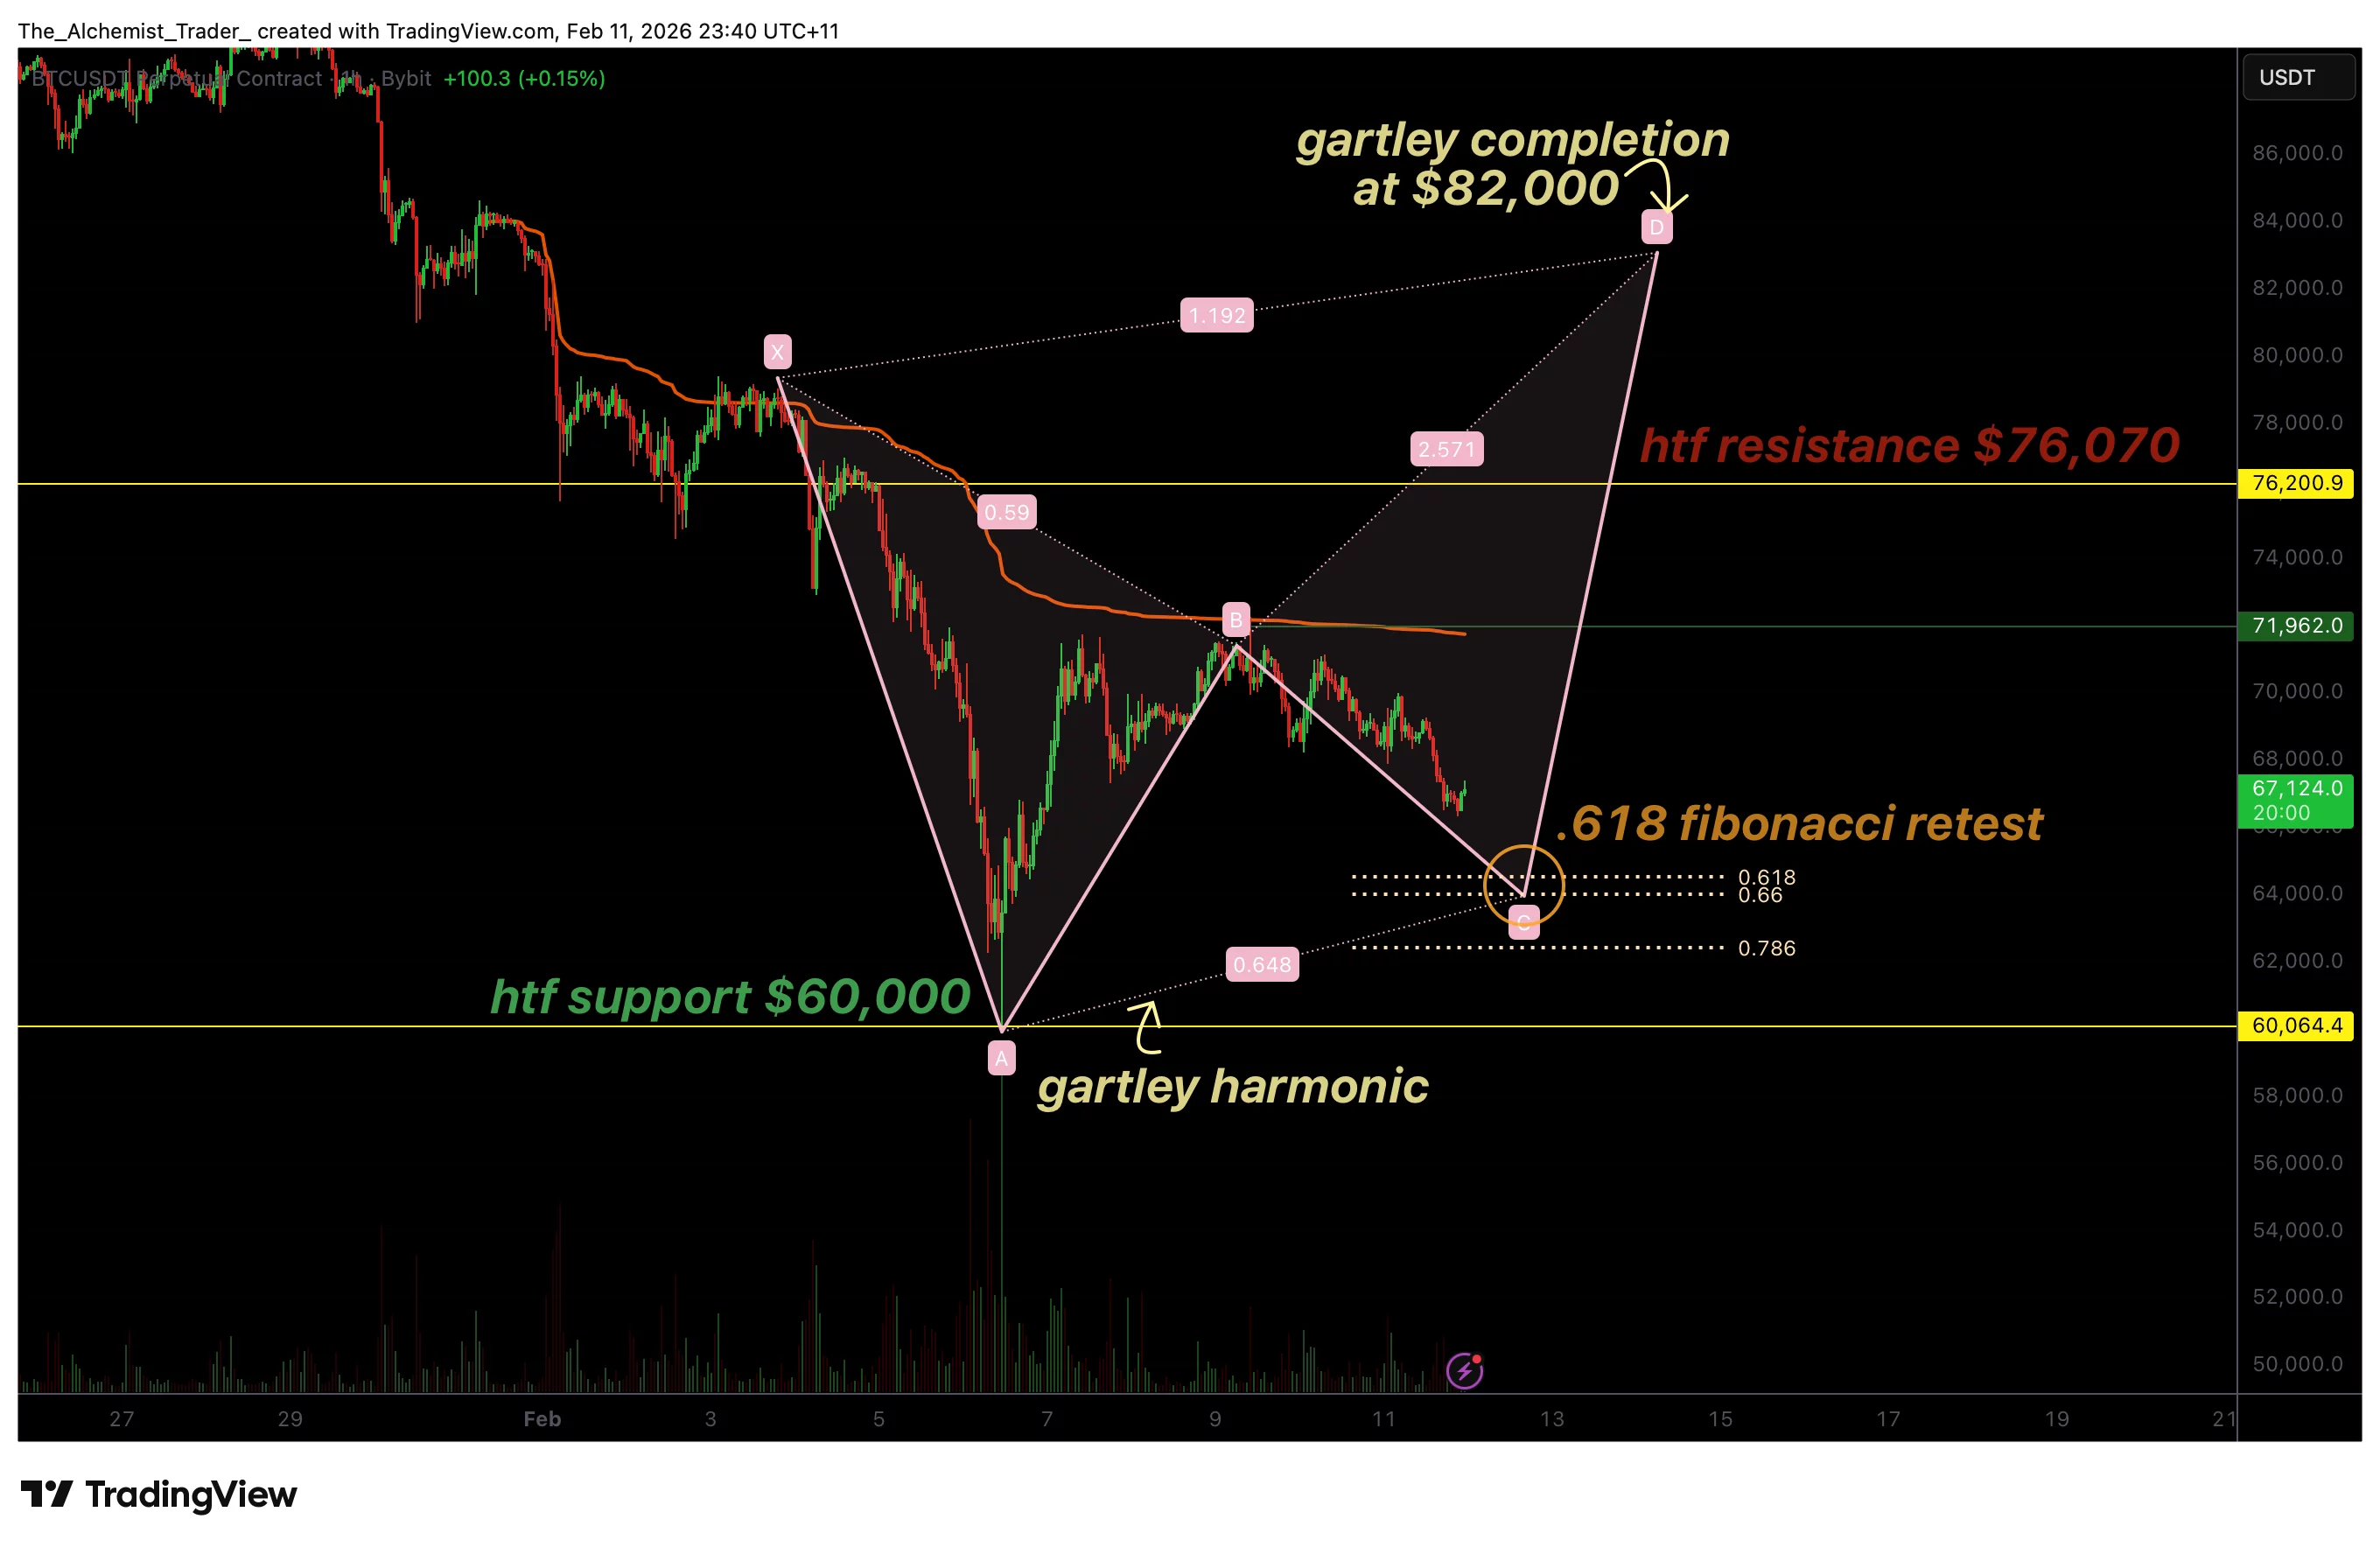
- Gartley harmonic pattern is forming, with the D-leg targeting $80,000–$82,000
- 0.618 Fibonacci retracement is acting as critical support, defining the C-leg
- Holding current support keeps reversal thesis intact, pending volume confirmation
Harmonic patterns are price structures built around precise Fibonacci ratios that reflect natural market symmetry. The Gartley harmonic, in particular, relies on key retracement and extension levels, most notably the 0.618 and 0.786 Fibonacci ratios, to define turning points in price action.
In Bitcoin’s case, the recent decline appears to have completed the A-to-B leg, followed by a corrective move into the 0.618 Fibonacci retracement, which now represents the C-leg of the structure. From this region, price action is beginning to stabilize, suggesting that the market may be preparing for the final D-leg of the pattern.
If the harmonic completes as expected, the projected D-leg target sits near the $80,000 to $82,000 region, an area that also aligns with prior high-timeframe resistance.
$60,000 support defines the reversal zone
One of the most important elements supporting the bullish harmonic thesis is Bitcoin’s ability to hold above the 0.618 Fibonacci retracement near the $60,000 region. This level has acted as a structural pivot in previous cycles and now serves as the foundation for a potential higher low.
As long as price remains above this support, the probability of a completed harmonic structure remains valid. A successful defense of this level would confirm that sellers are losing control and that buyers are beginning to absorb supply, a necessary condition for any meaningful reversal.
However, a decisive breakdown below this zone would invalidate the pattern and reopen downside risk.
Relief rally potential despite broader weakness
It is important to note that harmonic patterns often emerge during periods of broader market weakness. Strong downtrends frequently exhaust momentum before transitioning into corrective or relief rallies, which are commonly initiated by technical formations rather than fundamental catalysts.
In this context, Bitcoin’s recent bearish expansion may have created the conditions needed for a technical rebound. The developing Gartley pattern reflects this shift, suggesting that price may be preparing for a rotation higher even if the larger macro trend remains unresolved.
That said, any upside move will need to be supported by expanding bullish volume. Without volume confirmation, the rally would likely remain corrective rather than trend-defining.
What to expect in the coming price action
From a technical, price-action, and market-structure perspective, Bitcoin is approaching a key decision point. Holding above the 0.618 Fibonacci support keeps the Gartley harmonic structure intact and preserves the probability of a rally toward the $80,000–$82,000 target zone.
If price begins to push higher with improving volume and momentum, the D-leg completion could materialize in the near term. Conversely, failure to hold current support would invalidate the setup and shift focus back toward deeper consolidation.